What are precision, accuracy and mismatch
YellowScan provides three values with regards to a system's performance and specifications: precision, accuracy and mismatch. With these, you'll get a pretty clear idea of how your system performs ; however this is not the point cloud thickness. Let's dive in to understand what they mean.
Precision
Over hard surface, the standard deviation distances between LiDAR points originated from the same strip to their orthogonal projection to an average plane is computed. The value provided is the average standard deviation for all strips.
In summary:
- For each individual strip in selected areas, orthogonal distances from each point to the average plane from that strip are computed
- Standard deviation from the distances from each strip are averaged into Precision

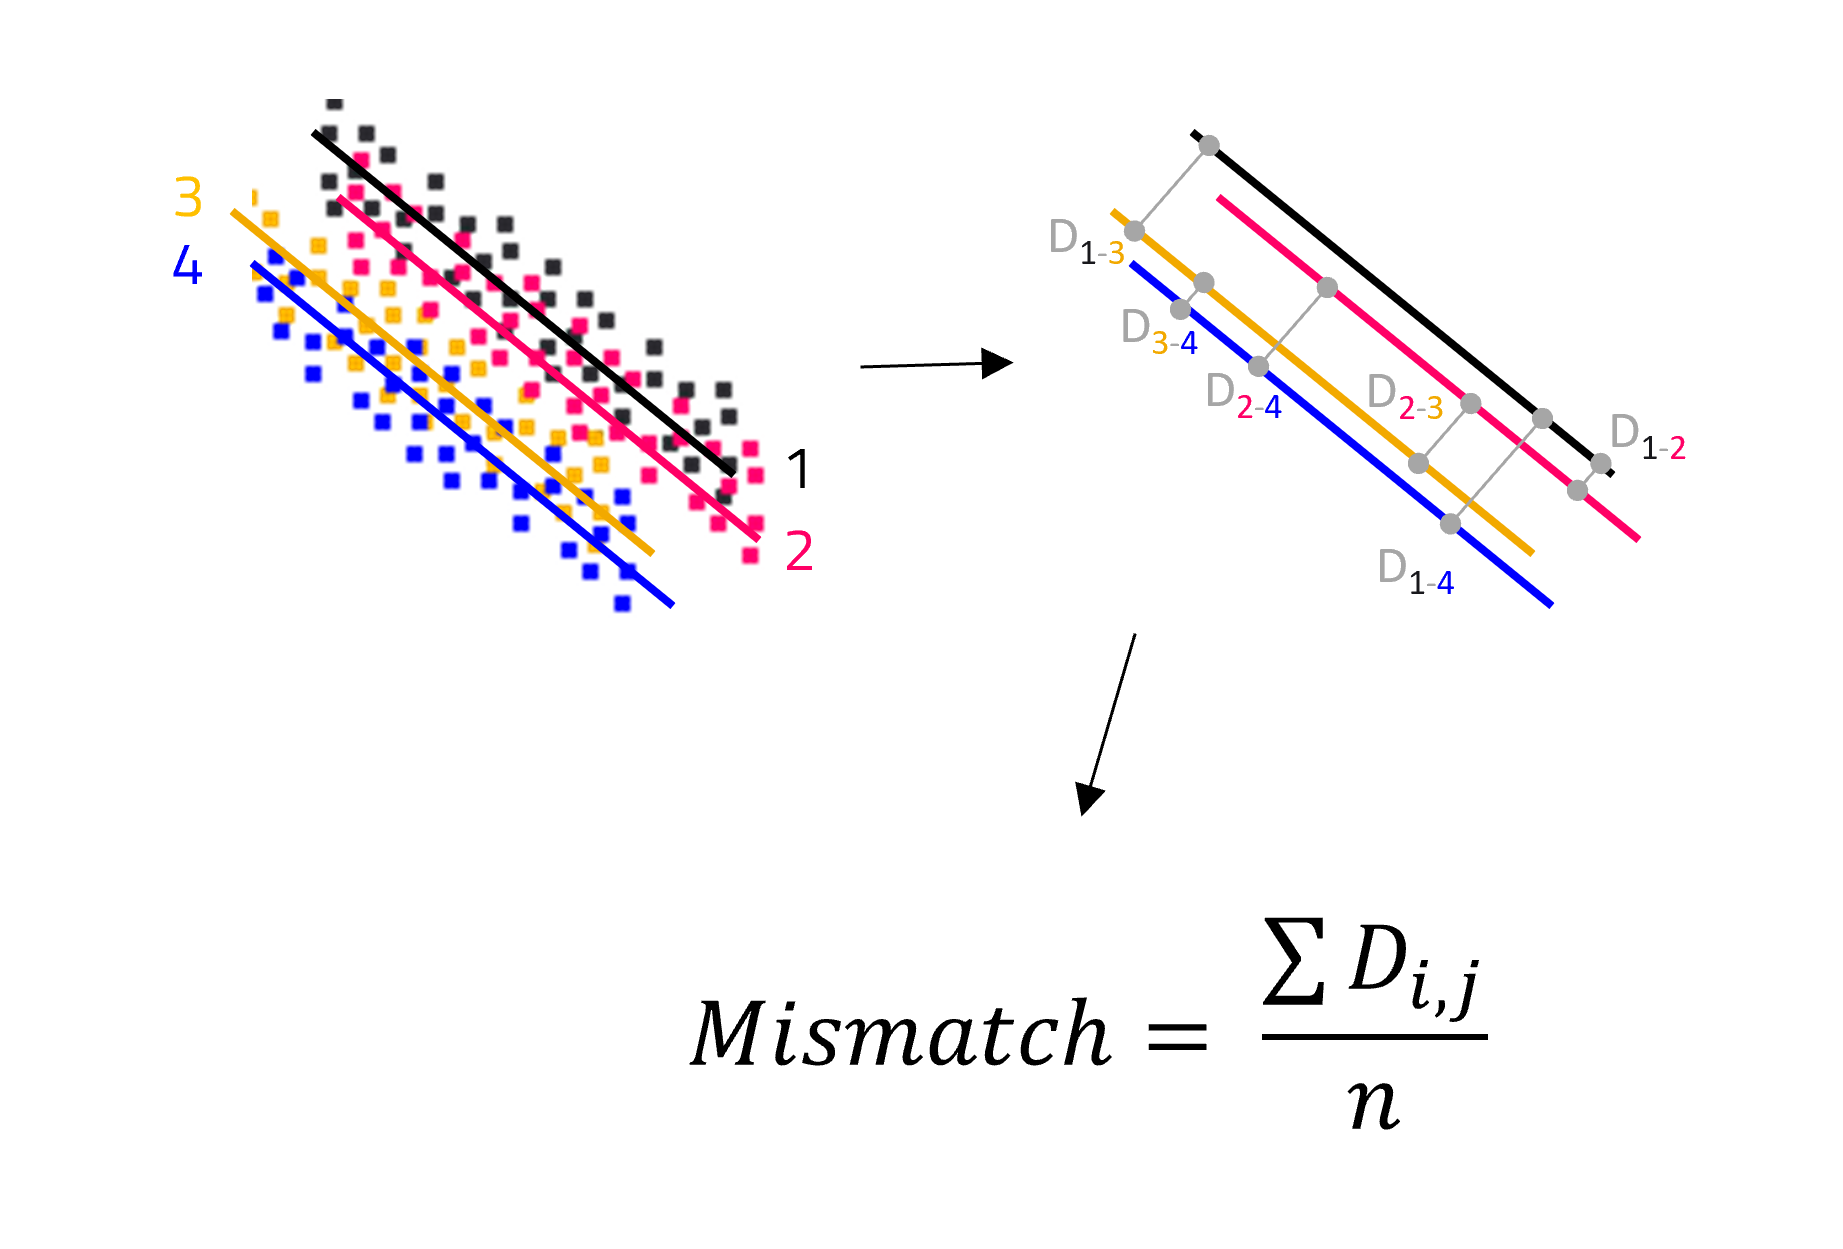
Mismatch
Over hard surface, LiDAR points originated from the same strip are interpolated as plane. Plane to plane distances are calculated for all pairs of strips and an average value is provided.
In summary:
- For selected areas, each strip is averaged to a plane
- For each pair of strips, plane-to-plane distances are computed
- The results of all plane-to-plane distances are averaged into the Mismatch value
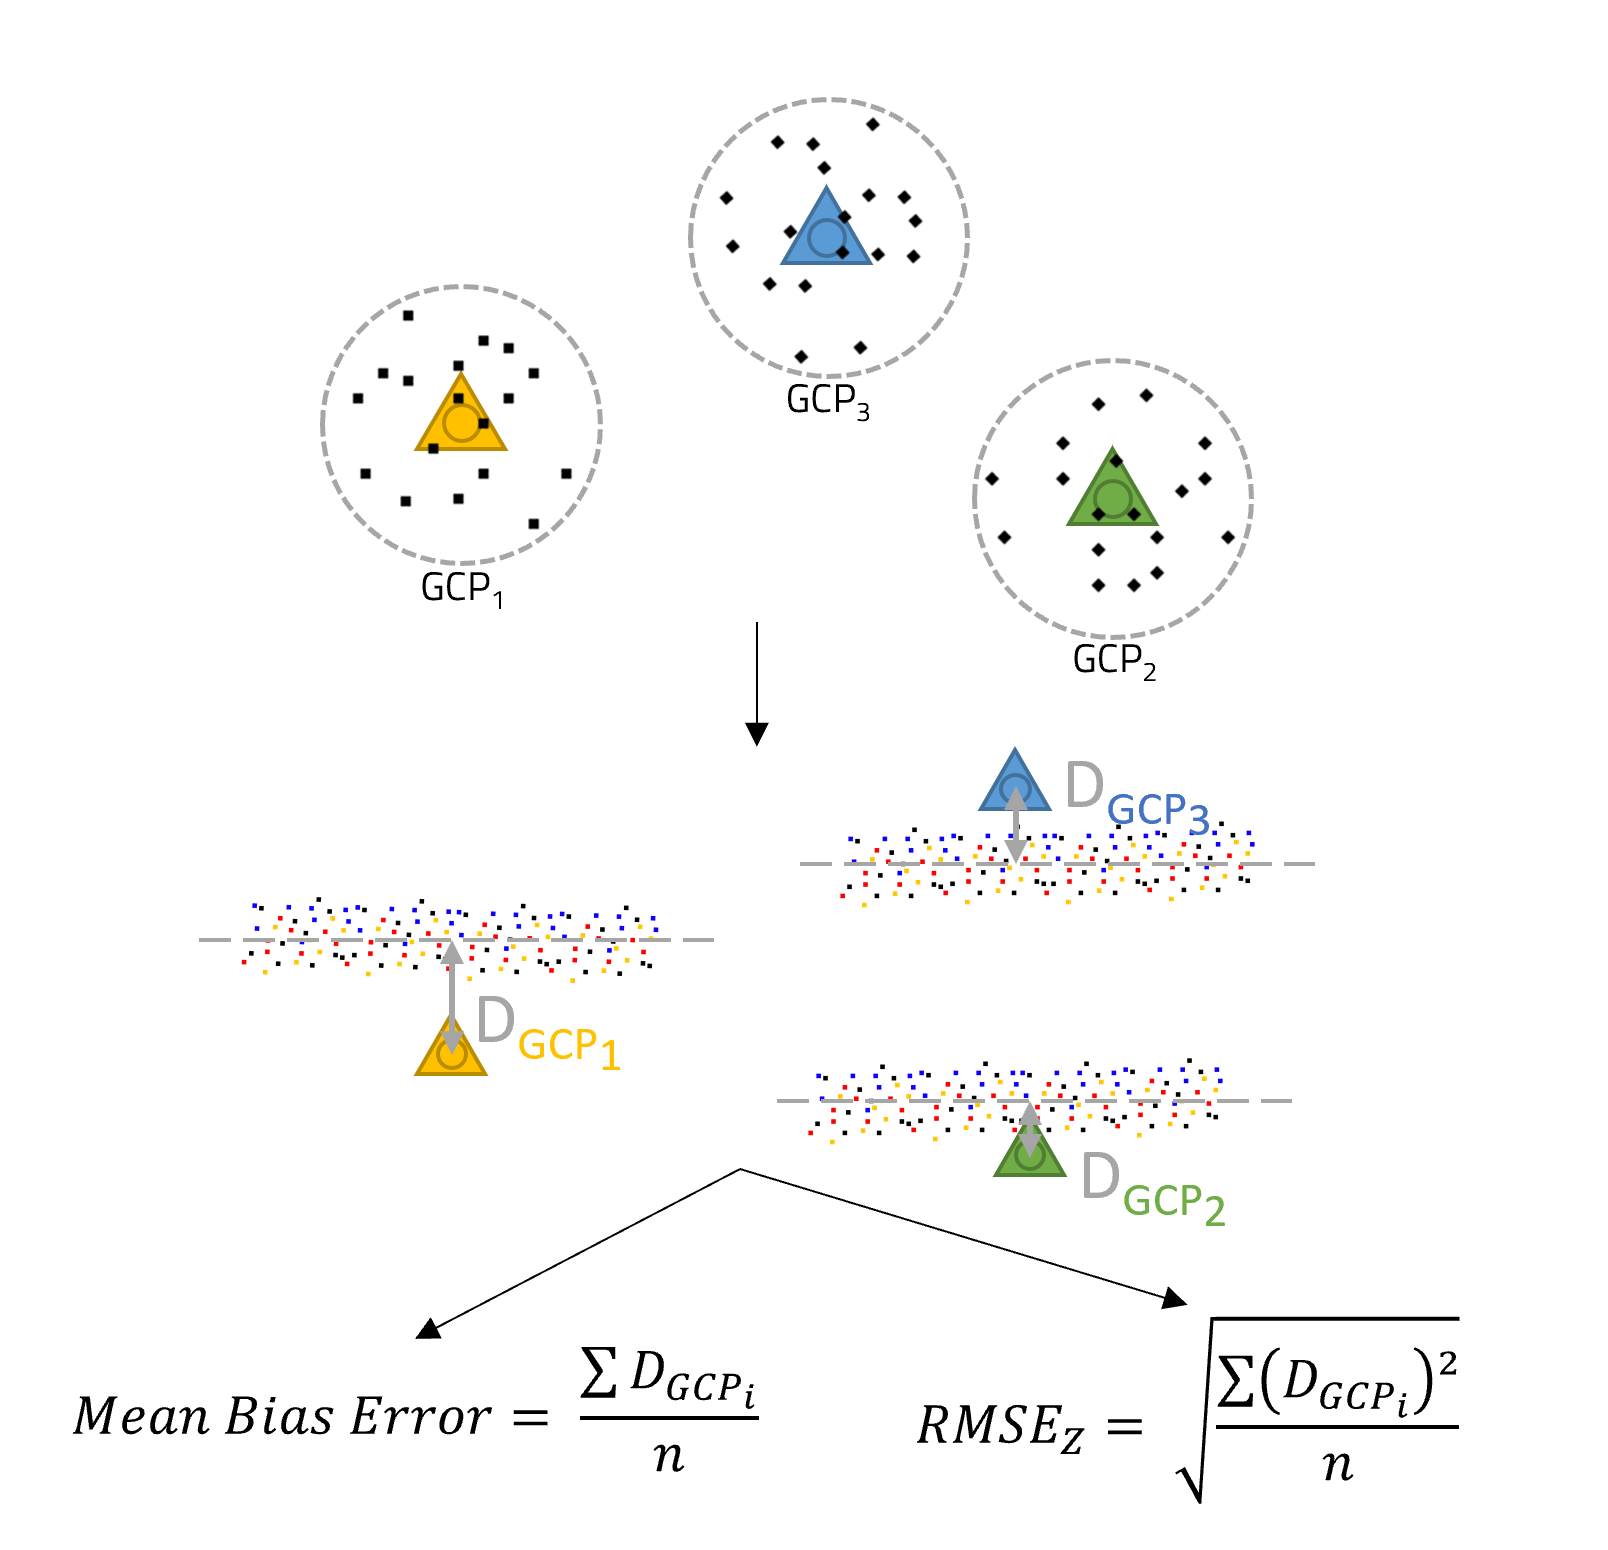
Accuracy
The error assessment based on ground truth points, yielding the RMSE(Z) and the Mean Bias Error, which is the mean of the differences between ground truth point elevation and the average elevation of LiDAR points located within a given radius to the corresponding ground truth points.
Computation of the accuracy values is done as follows:
- For each GCP, a radius is given to define a vicinity around it
- The average plane of this vicinity is defined from all points from all strips
- For each GCP, a single GCP-to-plane distance is computed
- The Mean Bias Error is the average of all GCP-to-plane distances DGCPi
- The Mean Bias Error has a sign and indicates how well the data is centered around the GCPs
- The RMSE represents the spread around the GCPs
- The RMSE is also computed from previous errors, squared then averaged
Normal Distribution
A normal distribution, also known as a Gaussian distribution, is a statistical pattern often found in various natural phenomena. In a normal distribution, data points are symmetrically distributed around a central mean value, creating a bell-shaped curve. The curve is characterized by its mean and standard deviation, which represent the average value and the spread of the data, respectively.

YellowScan gives precision values at one sigma (+σ). One sigma precision is widely used in fields like engineering, manufacturing, quality control, and scientific research.
For a 2 cm given precision, this means:
-
68.27% of the points are within +/-2cm (1σ) from the mean
-
95.45% of the points are within +/-4cm (2σ)
-
To get a more exhaustive picture, 99.73% of the points are within +/-6cm (3σ) of the mean.
It means that on a cross section, you can expect point distribution for close to 100% of the points to vary within a 12 cm (3σ x 2 = 3 x 2cm, doubled to account for each side of the mean value) thick slice, assuming the distribution is Gaussian.
Now, this does not include potential mismatches from overlapping strips, as precision will be given for a strip, from the average of all individual strips. Mismatch will create a thicker point cloud in overlapping areas. Cutting the overlap by only keeping the best points in overlapping areas may minimize the impact of mismatch.
All in all, it can be summarized by the following: errors tend to add up, yielding a resulting point cloud that's a combination of precision variation and mismatches. They all have to be considered when evaluating the quality of a point cloud, and no single value can give the definite answer as well.